Navigating access
Data science can significantly increase the impact of development programmes simply by optimising them.Two good examples of that are provided by our partners PIVOT in Madagascar and SOIL in Haiti.
© PIVOT
Data science is increasingly being used in development contexts to generate predictions or build models that are deployed by aid organisations to support effective strategy deployment. But analytics can also be used to significantly increase the impact of development programmes simply by optimising them.
Two good examples of how data science can be used for “optimisation” are provided by our partners PIVOT in Madagascar and SOIL in Haiti.
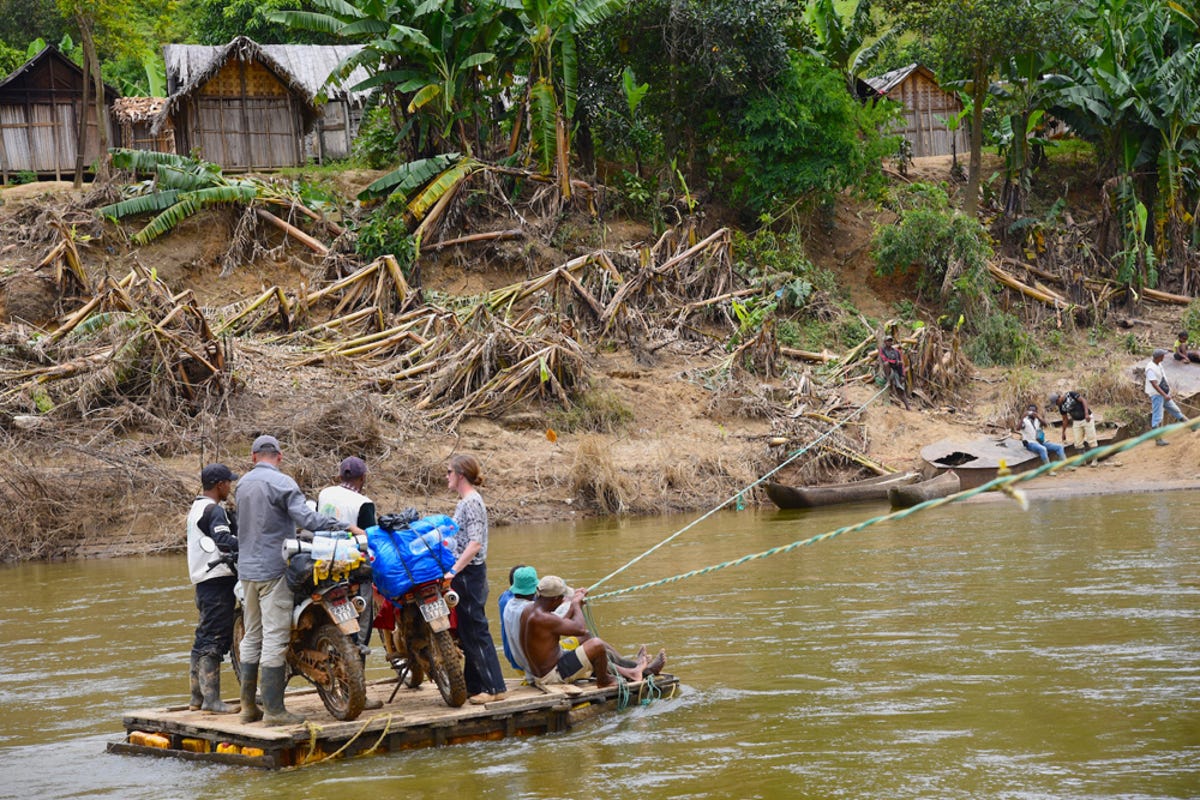
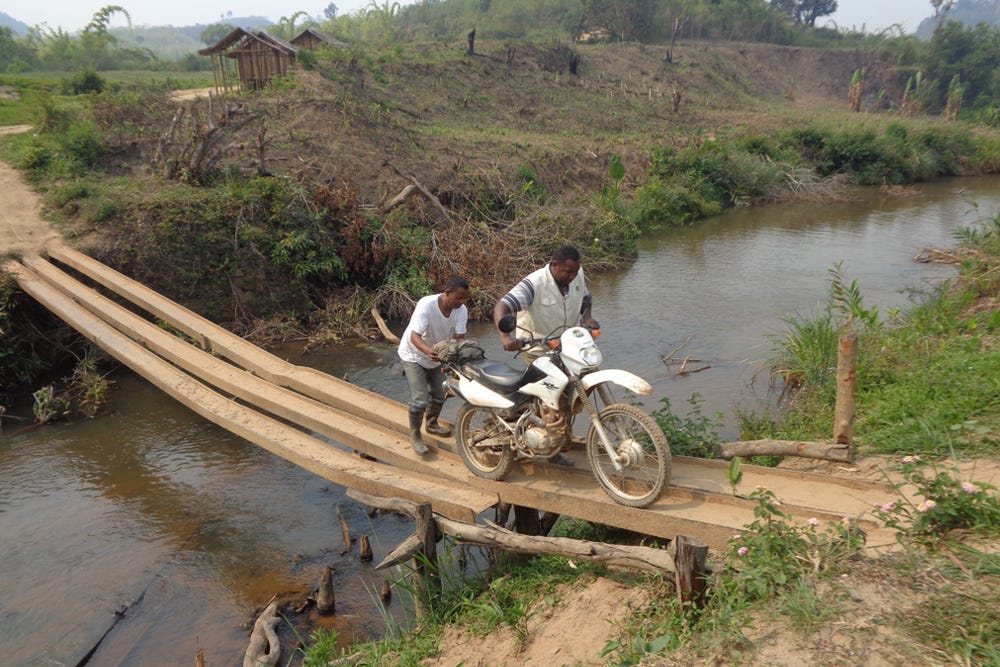
MAPPING THE SHORTEST ROUTES TO CARE
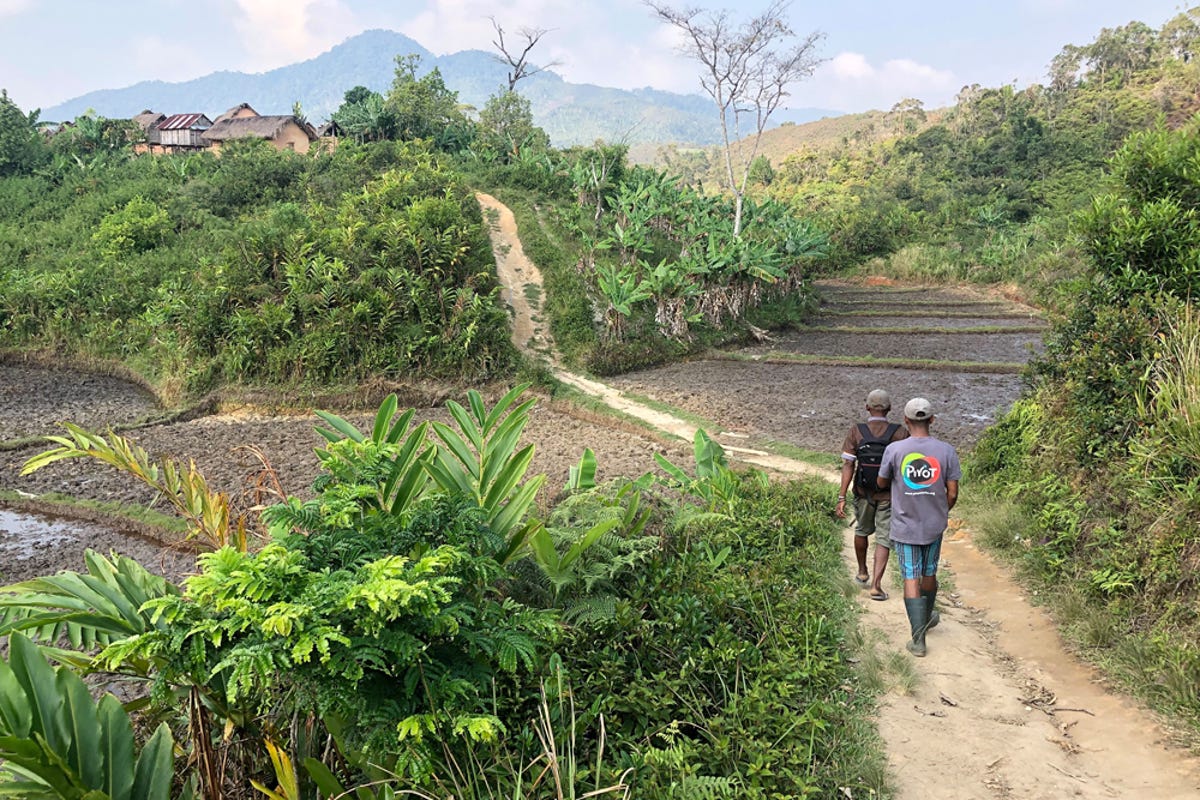
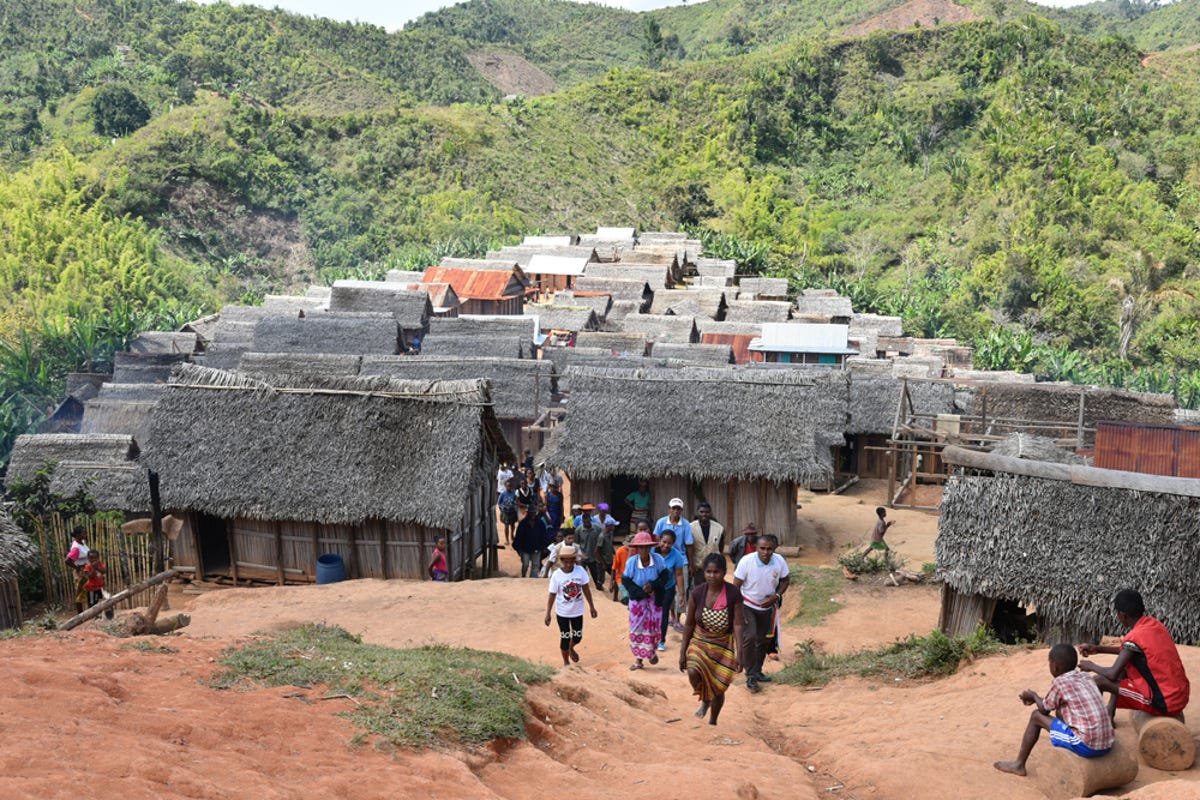
Madagascar conjures up images of lush rainforests, ancient baobab trees and ring-tailed lemurs. But the same stunning geography responsible for this unparalleled beauty also means more than three-quarters of the population are isolated in remote villages, far from services such as those offered at formal health clinics and hospitals, which can often only be reached by traveling for hours or days on foot or motorbike. Geography is in fact one of the most challenging barriers to achieving universal healthcare in the country, with the physical distance from a medical facility, roughness of the terrain and frequently impassable waterways determining whether a pregnant woman attends pre-natal check-ups or a child with severe malaria receives treatment. It’s a phenomenon known as “distance decay”.
Since 2014, PIVOT has been working in partnership with Madagascar’s Ministry of Public Health to transform a single rural district of approximately 200,000 people into a model of universal health coverage that can be replicated and scaled nationally. From the beginning, it was clear that “distance decay” and geographical access to care were substantial obstacles to any intervention aiming to improve health outcomes.
To tackle it, Dr. Felana Ihantamala, a Harvard Medical School health geographer and PIVOT researcher, worked for months to develop precise, context-specific estimates of geographical access to care points in Ifanadiana District. Her team mapped over 100,000 buildings, 13,000 hectares of rice paddies, 5,000 residential areas and a network of nearly 23,000 km of footpaths on OpenStreetMap. These data were collated with over 300,000 patient records. Travel speed models incorporating elevation and rainfall data were created and calibrated using GPS field data, identifying the shortest walking routes to seek care. Then the geographical accessibility results were integrated with service utilization and population health data in an e-health platform that provides PIVOT staff and other local health actors with accurate estimates of the shortest distance and travel time between virtually any two points in the district, together with key information for health programme planning and implementation, such as the areas with the lowest healthcare access.
As PIVOT’s Scientific Director Matt Bonds explains: “Dr. Ihantamalala’s work has enabled us to go deep - beyond the formal health system - providing us with what we need most: an understanding of what isn’t working, so it can be fixed.”
© PIVOT
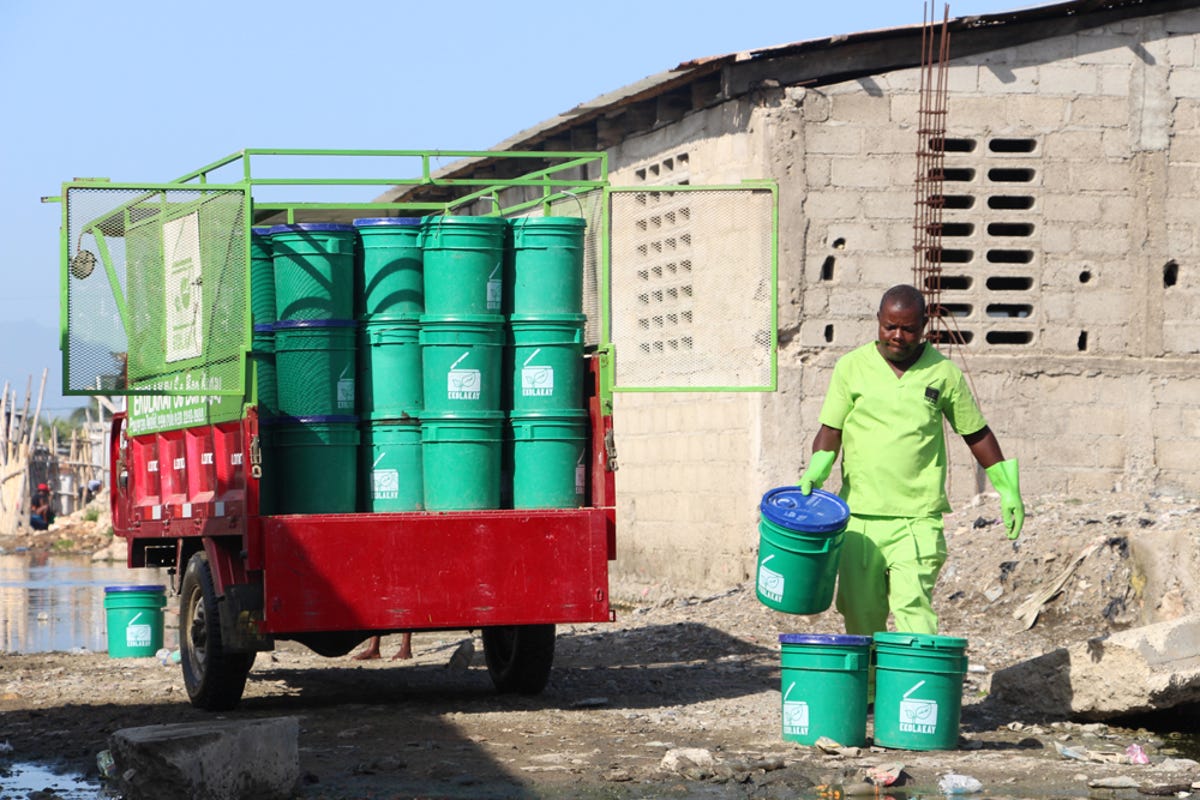
MASTERING HAITI'S URBAN MAZE
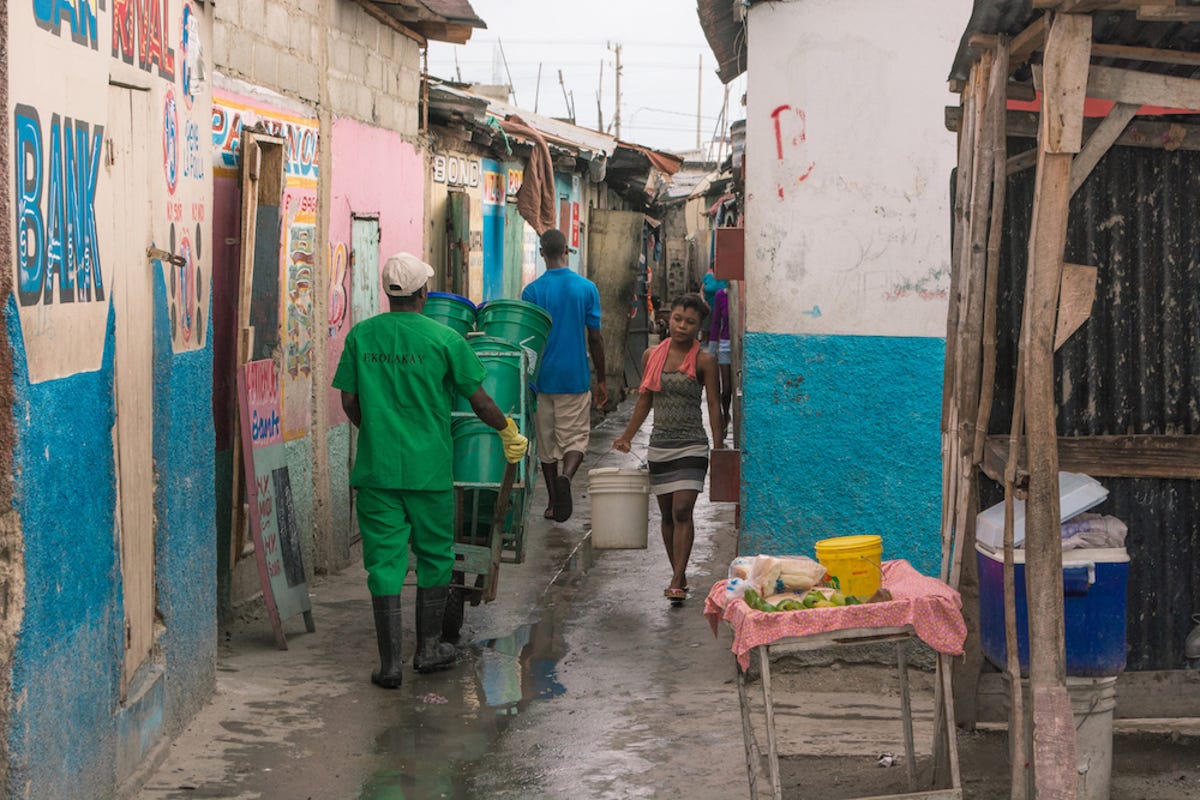
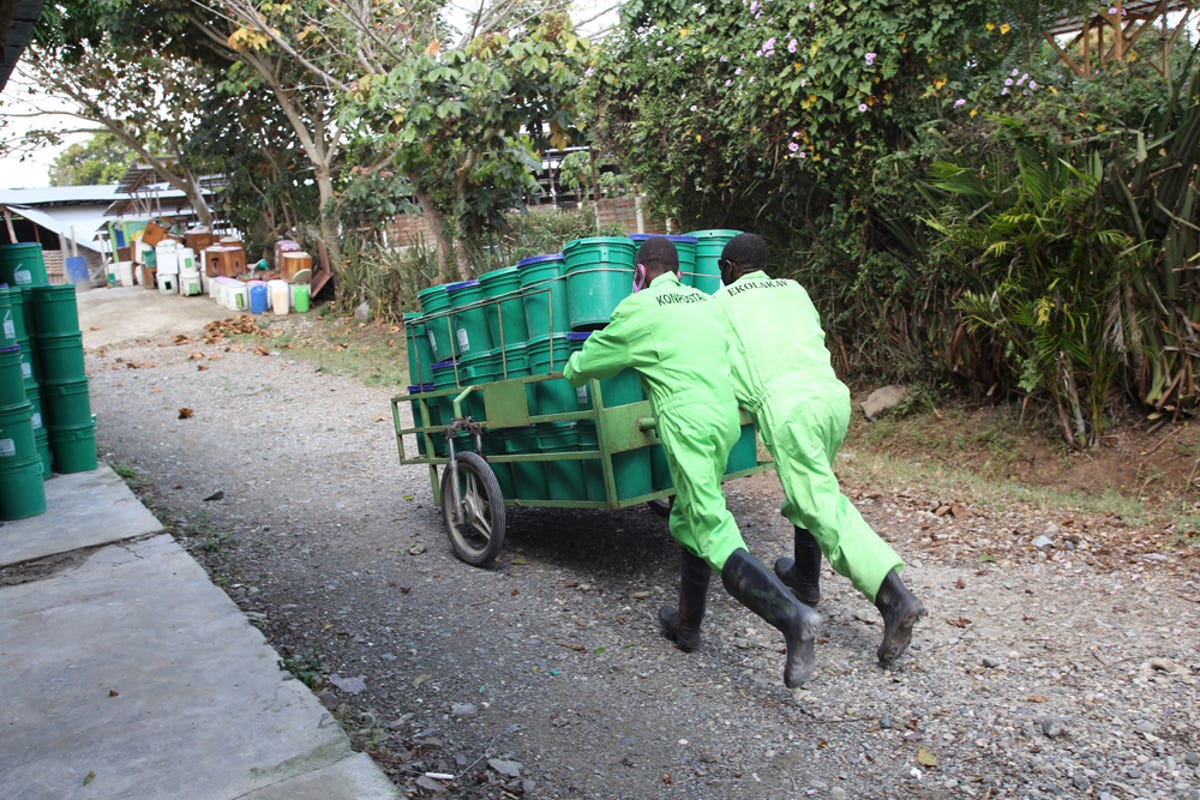
SOIL works in Haiti to provide affordable household sanitation services to families living in some of the island’s poorest urban communities. Its social business model involves providing affordable container-based toilets and related waste treatment services to urban communities, including the weekly collection of waste containers and the conversion of the waste into compost. Historically, collectors had always relied on memory, local knowledge and increased familiarity through regular collection rounds to find their way between households and make their pickups. However, with the steady increase in customer networks being served, any reduction in fuel, time or distance has become key to increased efficiency.
SOIL consequently needed to answer two questions: Firstly, given that its fleet of vehicles mostly comprises three- and four-wheeled mini trucks with limited capacity, what were the fewest trips needed to serve all SOIL’s customers when the number of containers could vary from household to household? And secondly, what was the most efficient route for each of those trips and how could they be mapped?
Working with DataKind data scientists, SOIL built an optimisation algorithm and leveraged open-source tools like OpenStreetMap, the Open Source Routing Machine and Google-Or Tools to generate optimised vehicle routes that take different road conditions and vehicle types into account.
SOIL collectors can now load simple web maps onto an offline app (that can be used in the field) on their mobile devices showing customer zones and all of their routes. Each map shows the turn-by-turn collection route that every vehicle needs to complete to visit all its planned customers for that day.
According to SOIL’s Director of Research and Innovation, Erica Lloyd, “understanding our container data has allowed us to hit as many households as possible in as efficient a way as possible, so we’re making sure that our vehicles are always coming back full.”
As a result, SOIL expects to cut its collection mileage and fuel use considerably. Indeed it has already achieved a 5% reduction in route distance since the maps have been used. Such efficiencies are essential to SOIL’s service expansion in the coming years.